
Fraud - | - Reports - | - Contact Truth About Lloyd's
Click on image to view
full size.
Click on image to view
full size.
Click on image to view full size.
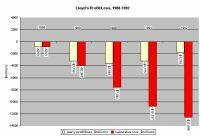
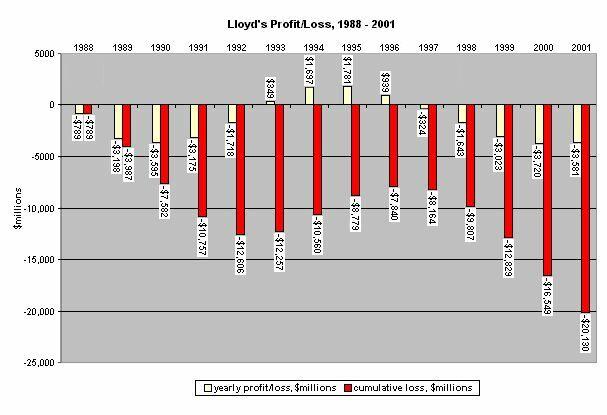
The charts below illustrate
the losses Lloyd's has generated between 1988 and 2001.
Chart 1

Chart 1 shows only the losses
as reported at the end of Lloyd's three-year accounting cycle. It does
not show the further deterioration of the losses after three years, or
the billions in claims (losses) that have been paid by Equitas since 1996.
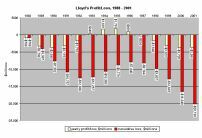
Chart 2

Chart 2 illustrates the old saying that "the more things change, the more they stay the same." After boasting of their return to profitability in 1993, and putting their "Reconstruction and Renewal" package into place in 1996, Lloyd's market fell back into loss, hemorrhaging billions of dollars from 1997 to 2001, in a pattern strikingly similar to the dismal performance of 1988 to 1992.
The losses shown in this chart
are as of the end of the three-year accounting cycle. It does not include
the ongoing deterioration of unclosed syndicate years of account for the
1997 to 2001 period.
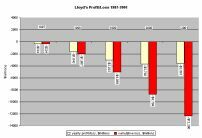
Chart 3
It should be noted that although
Lloyd's announced a return to profitability in the interim (1993-1996)
between the years covered in Charts 1 and 2, it was neither enough, nor
for long enough, to say that Lloyd's reforms had remedied that market's
loss-making trend.
With the benefit of hindsight, we know that Lloyd's hastily declared "early triple release" of "profits" for these particular years of account were to give the impression the market would again be profitable absent the burden of the 1992 and prior open years of account. Dozens of these supposedly profitable syndicates from the years of account '93, '94, and '95, however, subsequently issued cash calls to their underwriting Members. When it became apparent that what had been distributed "early" were syndicate reserves needed to pay routine claims, many cash calls languished unpaid. Not surprisingly, a large number of syndicates from this period ended up in runoff.
As reported by Business Insurance on October 23, 2006, ("KPMG survey reveals £38bn runoff liabilities in Britain") "Of the £38.2 billion total, some £7.5 billion (20%) of liabilities [$14 billion] are associated with open-year syndicates at Lloyd's of London, while £4.4 billion (11%) are with Equitas Ltd [$8.2 billion], which manages the runoff of Lloyd's 1992 and prior years nonlife liabilities." KPMG's report also says that Lloyd's has more than 100 post-1992 syndicates in run-off.
Table of source data for charts*
* All figures acquired from Lloyd's Global Reports or press statements.
Conversion factor used for source data: £1 = $1.55
Reports - | - Contact Truth About Lloyd's